Plugins
VisualVM functionality can be easily extended by official and 3rd party plugins. Use Tools | Plugins | Available Plugins to download plugins from VisualVM Plugins Center. IDE integration plugins are available here.
To extend VisualVM functionality in offline environments, get the plugins at Plugins Centers page and use Tools | Plugins | Downloaded to install them.
Due to changes in VisualVM 2.0 some third-party plugins may not work. Please contact their vendors and ask for an update.
|
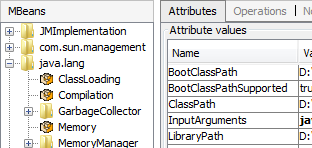
MBeans BrowserMBeans Browser plugin provides functionality similar to the MBeans Browser in JConsole: shows MBeans of an application, displays values, operations and notifications. In VisualVM the browser is further improved to deliver better usability and support for latest JMX features. |
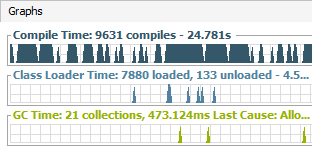
Visual GC PluginIntegration of the Visual Garbage Collection Monitoring Tool into VisualVM. Visual GC attaches to an application and collects and graphically displays garbage collection, class loader, and HotSpot compiler performance data. See the Visual GC tool page for details. |
|
|
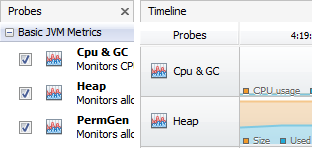
TracerFramework and GUI for detailed monitoring and analyzing Java applications. Using various probes, the Tracer gathers metrics from an application and displays the data in a timeline. The data are displayed both graphically and in a table and can be exported to common formats for further processing by external tools. |
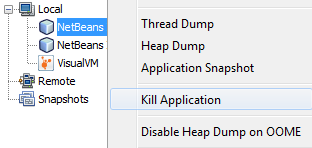
Kill ApplicationKill Application plugin allows to easily kill a monitored process, alive or deadlocked, by just a single mouse click. Eventually it uses a hard kill for processes that don't respond. |
|
|
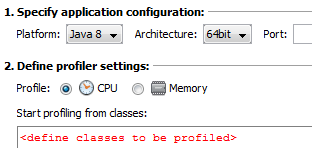
Startup ProfilerStartup Profiler plugin enables instrumented profiling of local Java 5+ applications from their startup and helps to profile short-running processes. See the Startup Profiler plugin page for more details. |
Other Plugins:
Go To Source: adds support for opening source code from within VisualVM. See the Sources Support page for more details.
Threads Inspector: enables analyzing stack traces of one or more threads in the Threads tab.
Buffer Monitor: monitoring usage of direct buffers created by ByteBuffer.allocateDirect and mapped buffers created by FileChannel.map.
Security: GUI for setting the keystore, truststore, protocols and ciphers for SSL/TLS connections in VisualVM, equivalent to setting appropriate system properties javax.net.ssl.* and javax.rmi.ssl.client.*
OQL Syntax Support: enhanced editor for OQL Console in HeapWalker providing syntax coloring and basic code completion.
JConsole Plugins Container: support for using existing JConsole plugins (like JTop) inside VisualVM.
VisualVM Extensions: support for additional functionality (such as new JDKs, JVMs, HotSpot versions, etc.) not supported by the VisualVM core modules at the time VisualVM was released.
Third Party Plugins:
BTrace Plugin: support for creating, deploying and saving BTrace scripts directly from the VisualVM. Home »
Coherence Plugin: summarized statistics and information for a JMX enabled Coherence cluster. Home »
CRaSH Plugin: support for the CRaSH open source shell for the Java Platform in VisualVM (VisualVM 1.x only). Home »
TDA Plugin: Thread Dump Analyzer is a GUI for analyzing thread dumps generated by the Java VM. Home »