Features
VisualVM monitors and troubleshoots applications running on Java 1.4+ from many vendors using various technologies including jvmstat, JMX, Serviceability Agent (SA) and Attach API.
VisualVM perfectly fits all the requirements of application developers, system administrators, quality engineers and end users.
|
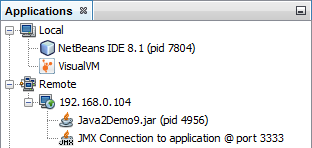
Display Local And Remote Java ProcessesVisualVM automatically detects and lists locally and remotely running Java applications (jstatd must be running on the remote host). You can also define applications manually by JMX connection. |
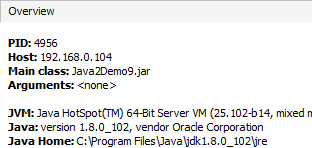
Display Process Configuration And EnvironmentFor each process VisualVM shows basic runtime information: PID, main class, arguments passed to java process, JVM version, JDK home, JVM flags and arguments and System properties. |
|
|
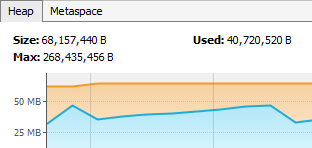
Monitor Process Performance And MemoryVisualVM monitors application CPU usage, GC activity, heap and metaspace / permanent generation memory, number of loaded classes and running threads. |
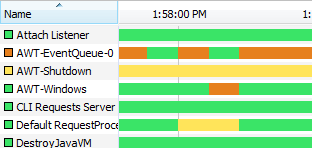
Visualize Process ThreadsAll threads running in a Java process are displayed in a timeline together with aggregated Running, Sleeping, Wait, Park and Monitor times. |
|
|
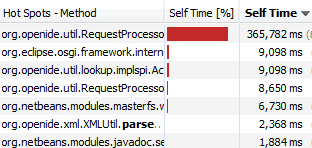
Profile Performance And Memory UsageVisualVM provides basic profiling capabilities for analyzing application performance and memory management. Both sampling and instrumentation profilers are available. |
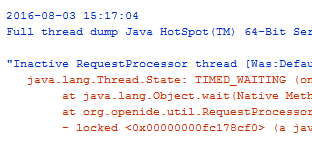
Take And Display Thread DumpsVisualVM takes and displays thread dumps for an immediate insight of what is going on in the target process. Simultaneous thread dumps of multiple processes help to discover distributed deadlocks. |
|
|
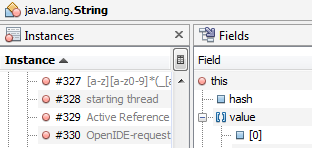
Take And Browse Heap DumpsVisualVM creates and views .hprof memory snapshots created on demand or on OutOfMemoryError to help with uncovering inefficient heap usage and debugging memory leaks. |
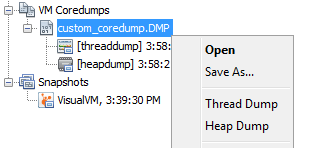
Analyze Core DumpsVisualVM is able to read basic information about the crashed Java process and its environment from a core dump as well as extract and open the contained thread and heap dumps. |
|
|
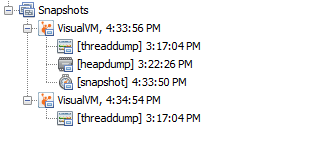
Analyze Applications OfflineVisualVM is able to save application configuration and runtime environment together with all taken thread dumps, heap dumps and profiler snaphots into a single application snapshot which can be later processed offline. |