Startup Profiler
Startup Profiler plugin for VisualVM 1.3.6 and newer enables instrumented profiling of local Java 5+ applications from their startup. It is also helpful when profiling short-running processes.
The current version of the plugin requires the profiled application to be started by the user running the host VisualVM instance. Profiling startup of remote applications is not supported.
Installing the Plugin
- Make sure you are running VisualVM 1.3.6 or newer (download)
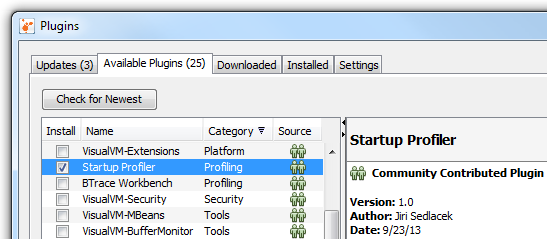
- In VisualVM main menu invoke Tools | Plugins, switch to Available Plugins tab and select the Startup Profiler plugin
- Click the Install button, review and accept plugin license and wait for the plugin to be downloaded and installed
After a successful installation the plugin adds a new menu item Applications | Profile Startup and a new toolbar action "Start new process and profile its startup", see the next section.
Profiling Startup
To start profiling application startup, invoke either the Applications | Profile Startup menu action or the plugin action in VisualVM toolbar:

The action opens a Profile Startup dialog which configures the profiled application and profiling session. The configuration consists of the following three steps:
1. Specify Application Configuration
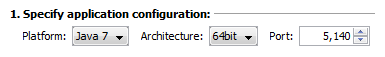
The first step specifies the configuration of the profiled application. Select the Java platform including 32bit or 64bit architecture that will run the profiled application.
You may also customize the profiling port, default value is 5140.
Note that only the Java platforms and architectures supported by Startup Profiler and host VisualVM instance are available. If the Platform and/or Architecture option is disabled, it means only the selected value is supported.
2. Define Profiler Settings
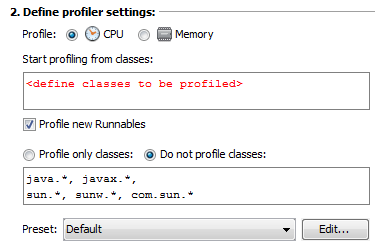
The second step defines profiling settings used for the session. Choose whether you want to profile performance or memory of the application and define the desired settings.
See the Profiling With VisualVM, Part 2 article for detailed information on the profiling settings.
For CPU profiling, you have to define the profiling starting point(s). See the tooltip for a hint on the required format. At least you should clear the text field, which will setup the profiler to start profiling from the application's main method and will also profile each new Thread and/or Runnable. Note that the profiling overhead will be significant in this case.
To get a reasonable profiling data, you should define custom starting point like org.mypackage.** or a more specific org.mypackage.subpackage.* or org.mypackage.MyClass. The more concrete starting point and restrictive Profile only/Do not profile filter you define, the lower is the profiling overhead. When custom starting points are defined, the Profile new Runnables option should typically be unchecked.
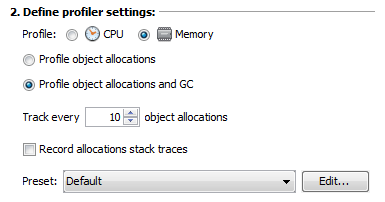
For Memory profiling, you can continue with the defaults. The Profile object allocations and GC mode is useful for uncovering slow memory leaks as it provides the Generations count (see the What Do The Surviving Generations Metrics Mean? article for details). The Profile object allocations mode can be used to see live instances and their trends.
The profiling overhead is always significant when profiling memory, but can be reduced a bit by not tracking each object's allocation. Tracking each 10th object (the default) is typically enough to see the allocation trends and/or monitor the Generations count. If you want to find out from where in the code the objects are being allocated, select the Record allocations stack traces option.
Once the profiling session starts and the profiled application opens in VisualVM, you can see the live profiling data, which is just a subset of the information provided by the profiler. To see the call trees for CPU data or stack traces for memory allocations, take a snapshot of the profiling results!
3. Setup Profiled Application
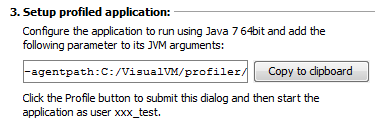
The third step instructs how to setup the target application and start the profiling session. Make sure the application is configured to run using the defined Java platform and architecture. Add the provided parameter to its JVM arguments. Note that the parameter changes by selecting different configurations in the first step. The command to start the profiled application typically looks like this:
C:\jdk1.7.0_64b\bin\java.exe -agentpath:C:/VisualVM/profiler/lib/deployed/jdk16/windows-amd64/profilerinterface.dll=C:\VisualVM\profiler\lib,5140 -jar MyApp.jar
When profiling startup of a Java 5 application, you may also want to add another parameter -Dcom.sun.management.jmxremote before the -agentpath parameter to enable the JMX agent in profiled application. This will provide you with additional monitoring and troubleshooting features for the application like displaying CPU usage or taking heap dumps which are not available by default.
Once the target application is configured, it is important to submit the Profile Startup dialog first and after that start the application. The profiler checks whether the application hasn't been started prior to submitting the dialog and eventually asks the user to terminate it if started too soon. Note that the application must be started by the user running the host VisualVM instance, otherwise the profiling data may not be available.
After submitting the Profile Startup dialog, the profiler checks whether the target Java platform has already been calibrated for profiling. If not, it will ask you to select the correct Java binary and calibrates it. To get unbiased calibration data, make sure there's no heavy load running on the machine and disable any dynamic CPU frequency switching technology if enabled.
As soon as the profiler is ready for profiling startup of the application, it will display a Progress dialog saying "Connecting to the target VM...". This is the right time to start the profiled application. The profiler connects to the application immediately and you should see messages in the profiled application's terminal or log similar to these:
Profiler Agent: Initializing...
Profiler Agent: Options: >C:\VisualVM\profiler\lib,5140<
Profiler Agent: Initialized successfully
Profiler Agent: Waiting for connection on port 5140 (Protocol version: 13)
Profiler Agent: Established connection with the tool
Profiler Agent: Local accelerated session
Now the profiled application appears in the Applications view in VisualVM and shortly after it's opened and switched to the Profiler tab displaying the live profiling data. A short-living process being profiled can finish its execution sooner than recognized or opened in VisualVM. For this case the profiler displays a notification dialog allowing to take a final snapshot of the collected profiling data. The profiled process is kept alive until the dialog is closed, so you may want to wait a while for the application to open before clicking OK.
After finishing the profiling session, you may directly terminate the profiled application. This is faster than stopping the profiling session in VisualVM, which just removes the bytecode instrumentation from the application and doesn't terminate its process. Note that for Java 5 applications you won't be able to re-attach the profiler to the running process once the profiling session has been finished.
Problems & Troubleshooting
Please see the VisualVM Troubleshooting Guide for resolving general problems related to using VisualVM. The following list contains the typical problems and situations expected to occur when profiling startup of an application using the Startup Profiler plugin:
Profiled application does not start
When started the application with the provided -agentpath parameter, its terminal or log should display messages similar to the above section. If you see any error messages instead, it means that the application failed to start. This is most likely caused by incorrect -agentpath parameter. Doublecheck that the application runs using the Java platform and architecture selected in the Profile Startup dialog and make sure the parameter is typed exactly as provided by the dialog. Also verify that the profiling port isn't blocked by a firewall or already used.
Profiled application started too soon
Seeing a warning dialog which asks you to terminate the application means that you have started it before the "Connecting to the target VM..." dialog appeared. Terminate the application and start it again, the profiling session will continue automatically. In case the dialog keeps displaying and you are sure the application does not run, manually delete the .nbprofiler/<port> file in your user directory, close the dialog and start the profiled application again.
Another profiling session in progress
If this dialog is displayed after invoking the Profile Startup action, it means that the previous profiling session has not been fully finished yet. Wait for a few seconds before invoking the action again. In case there was an error during the last profiling session and it failed to cleanup, the dialog may be displayed even if no profiling session is in progress. Open a different application for which the Profiler tab is available or restart VisualVM to fix this problem.
Profiled application is not opened
In case the profiled application isn't displayed in the Applications view and/or doesn't open in VisualVM, make sure it has been started by the same user running the host VisualVM instance. Applications started by a different user are not supported by the Startup Profiler. If the problem still persists, please check the application terminal/log and VisualVM logfile (Help | About | Logfile) for any errors.
Profiled application finished with no data or snapshot
For CPU profiling the live profiling results may be empty and/or the profiler doesn't offer to take a final snapshot on application termination. This happens when no profiling results have been collected, which typically means that wrong profiling starting points and/or filter have been defined. Use a more general starting point and/or less restrictive filter, see the 2. Define profiler settings section for details.
Haven't found the solution? Let us know using the Feedback page or file a bug to get help!